08 / Project
Living Systems · IoT · Independent R&D
PermaTech
Environmental Intelligence Platform
Connecting physical environments with digital intelligence.
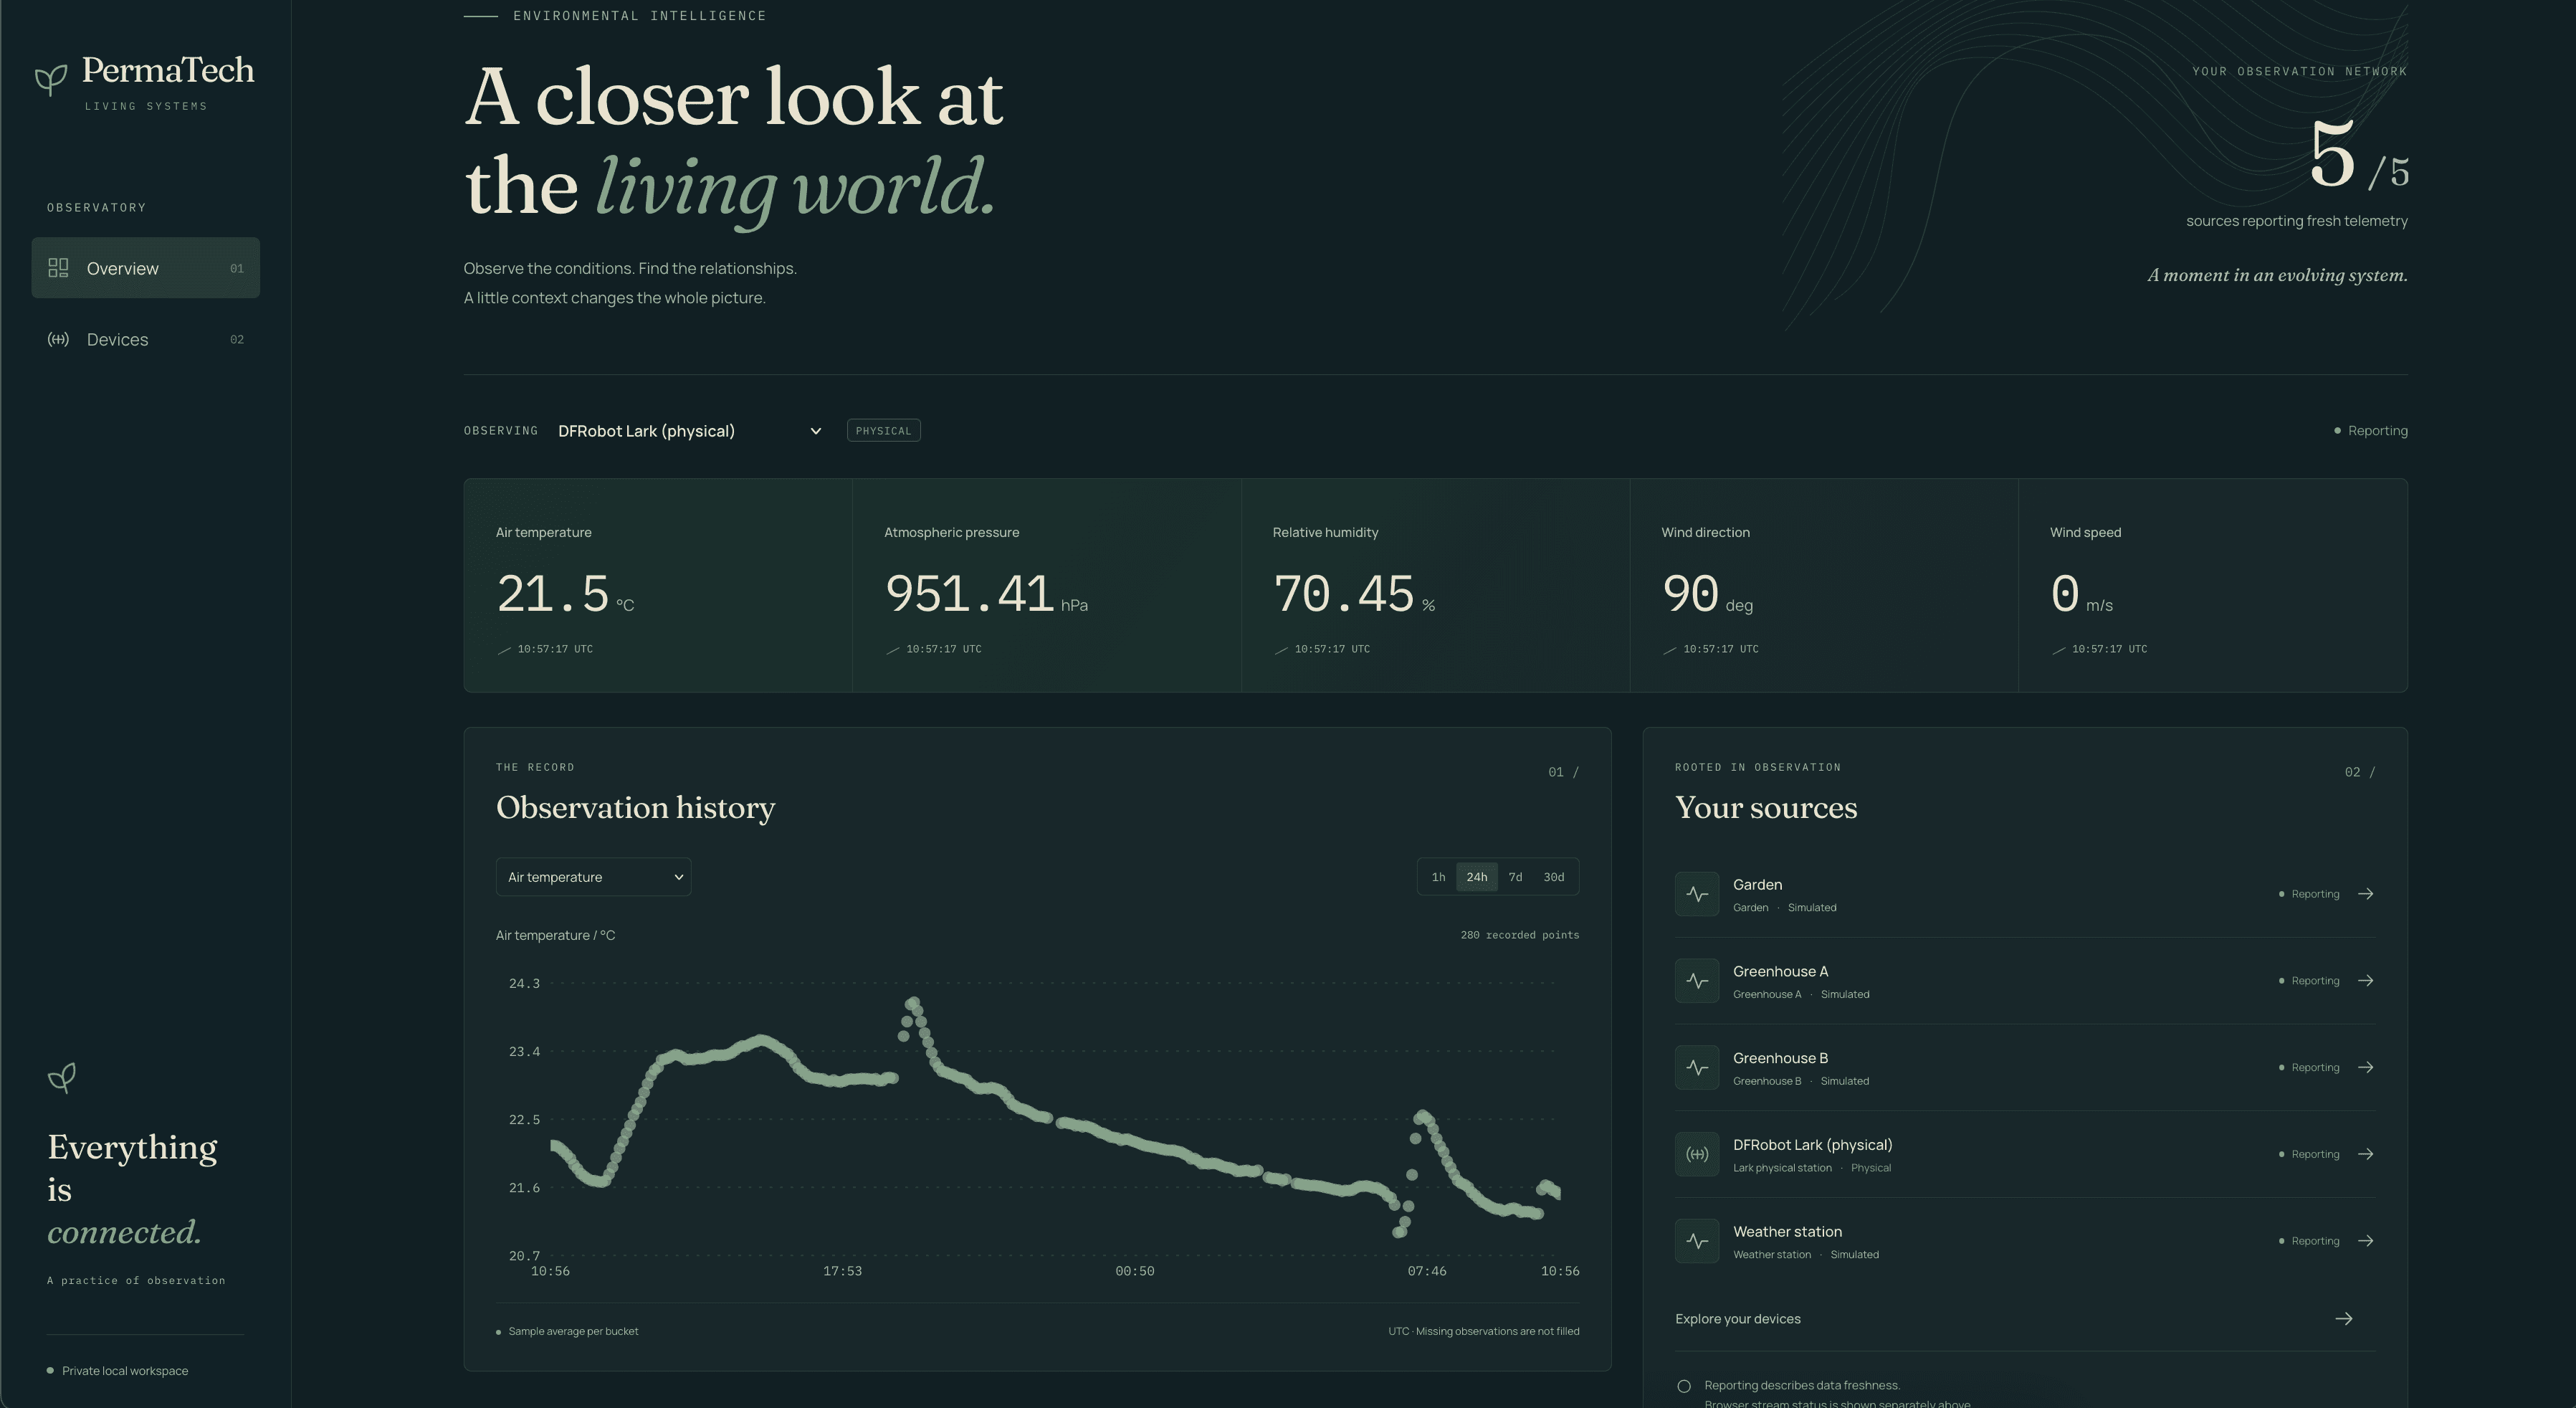
PermaTech is an experimental environmental monitoring platform at the intersection of physical computing, data engineering and interactive digital experiences.
I designed it end to end, from embedded firmware and wireless communication through data storage, real-time APIs and a custom visual interface. It explores how physical measurements can help us understand the living systems around us.
- My role
- Concept, UX/UI Design, System Architecture, Full-stack Development, IoT Integration and AI-assisted Engineering
- Year
- 2026 — Ongoing
- Project type
- Experimental
- Categories
- Creative technology / IoT / Full-stack development / Data visualization
- Areas
- Full-stack development / IoT / Data visualization
- Technologies
- ESP8266 · C++ · MQTT · Node.js · TypeScript · PostgreSQL · Drizzle ORM · Express · WebSocket · Next.js · React · Tailwind CSS · TanStack Query · Zod · Docker · Jest · Playwright
01 / Context
Understanding living systems
Temperature, humidity, atmospheric pressure and wind change together. A reading captures a moment, but it takes a series of observations to see how conditions evolve.
PermaTech grew out of an interest in environmental monitoring, regenerative practices and connected devices. The challenge was to design a system that could collect physical observations, process them reliably and make them straightforward to explore.
02 / Hardware and firmware
Physical computing
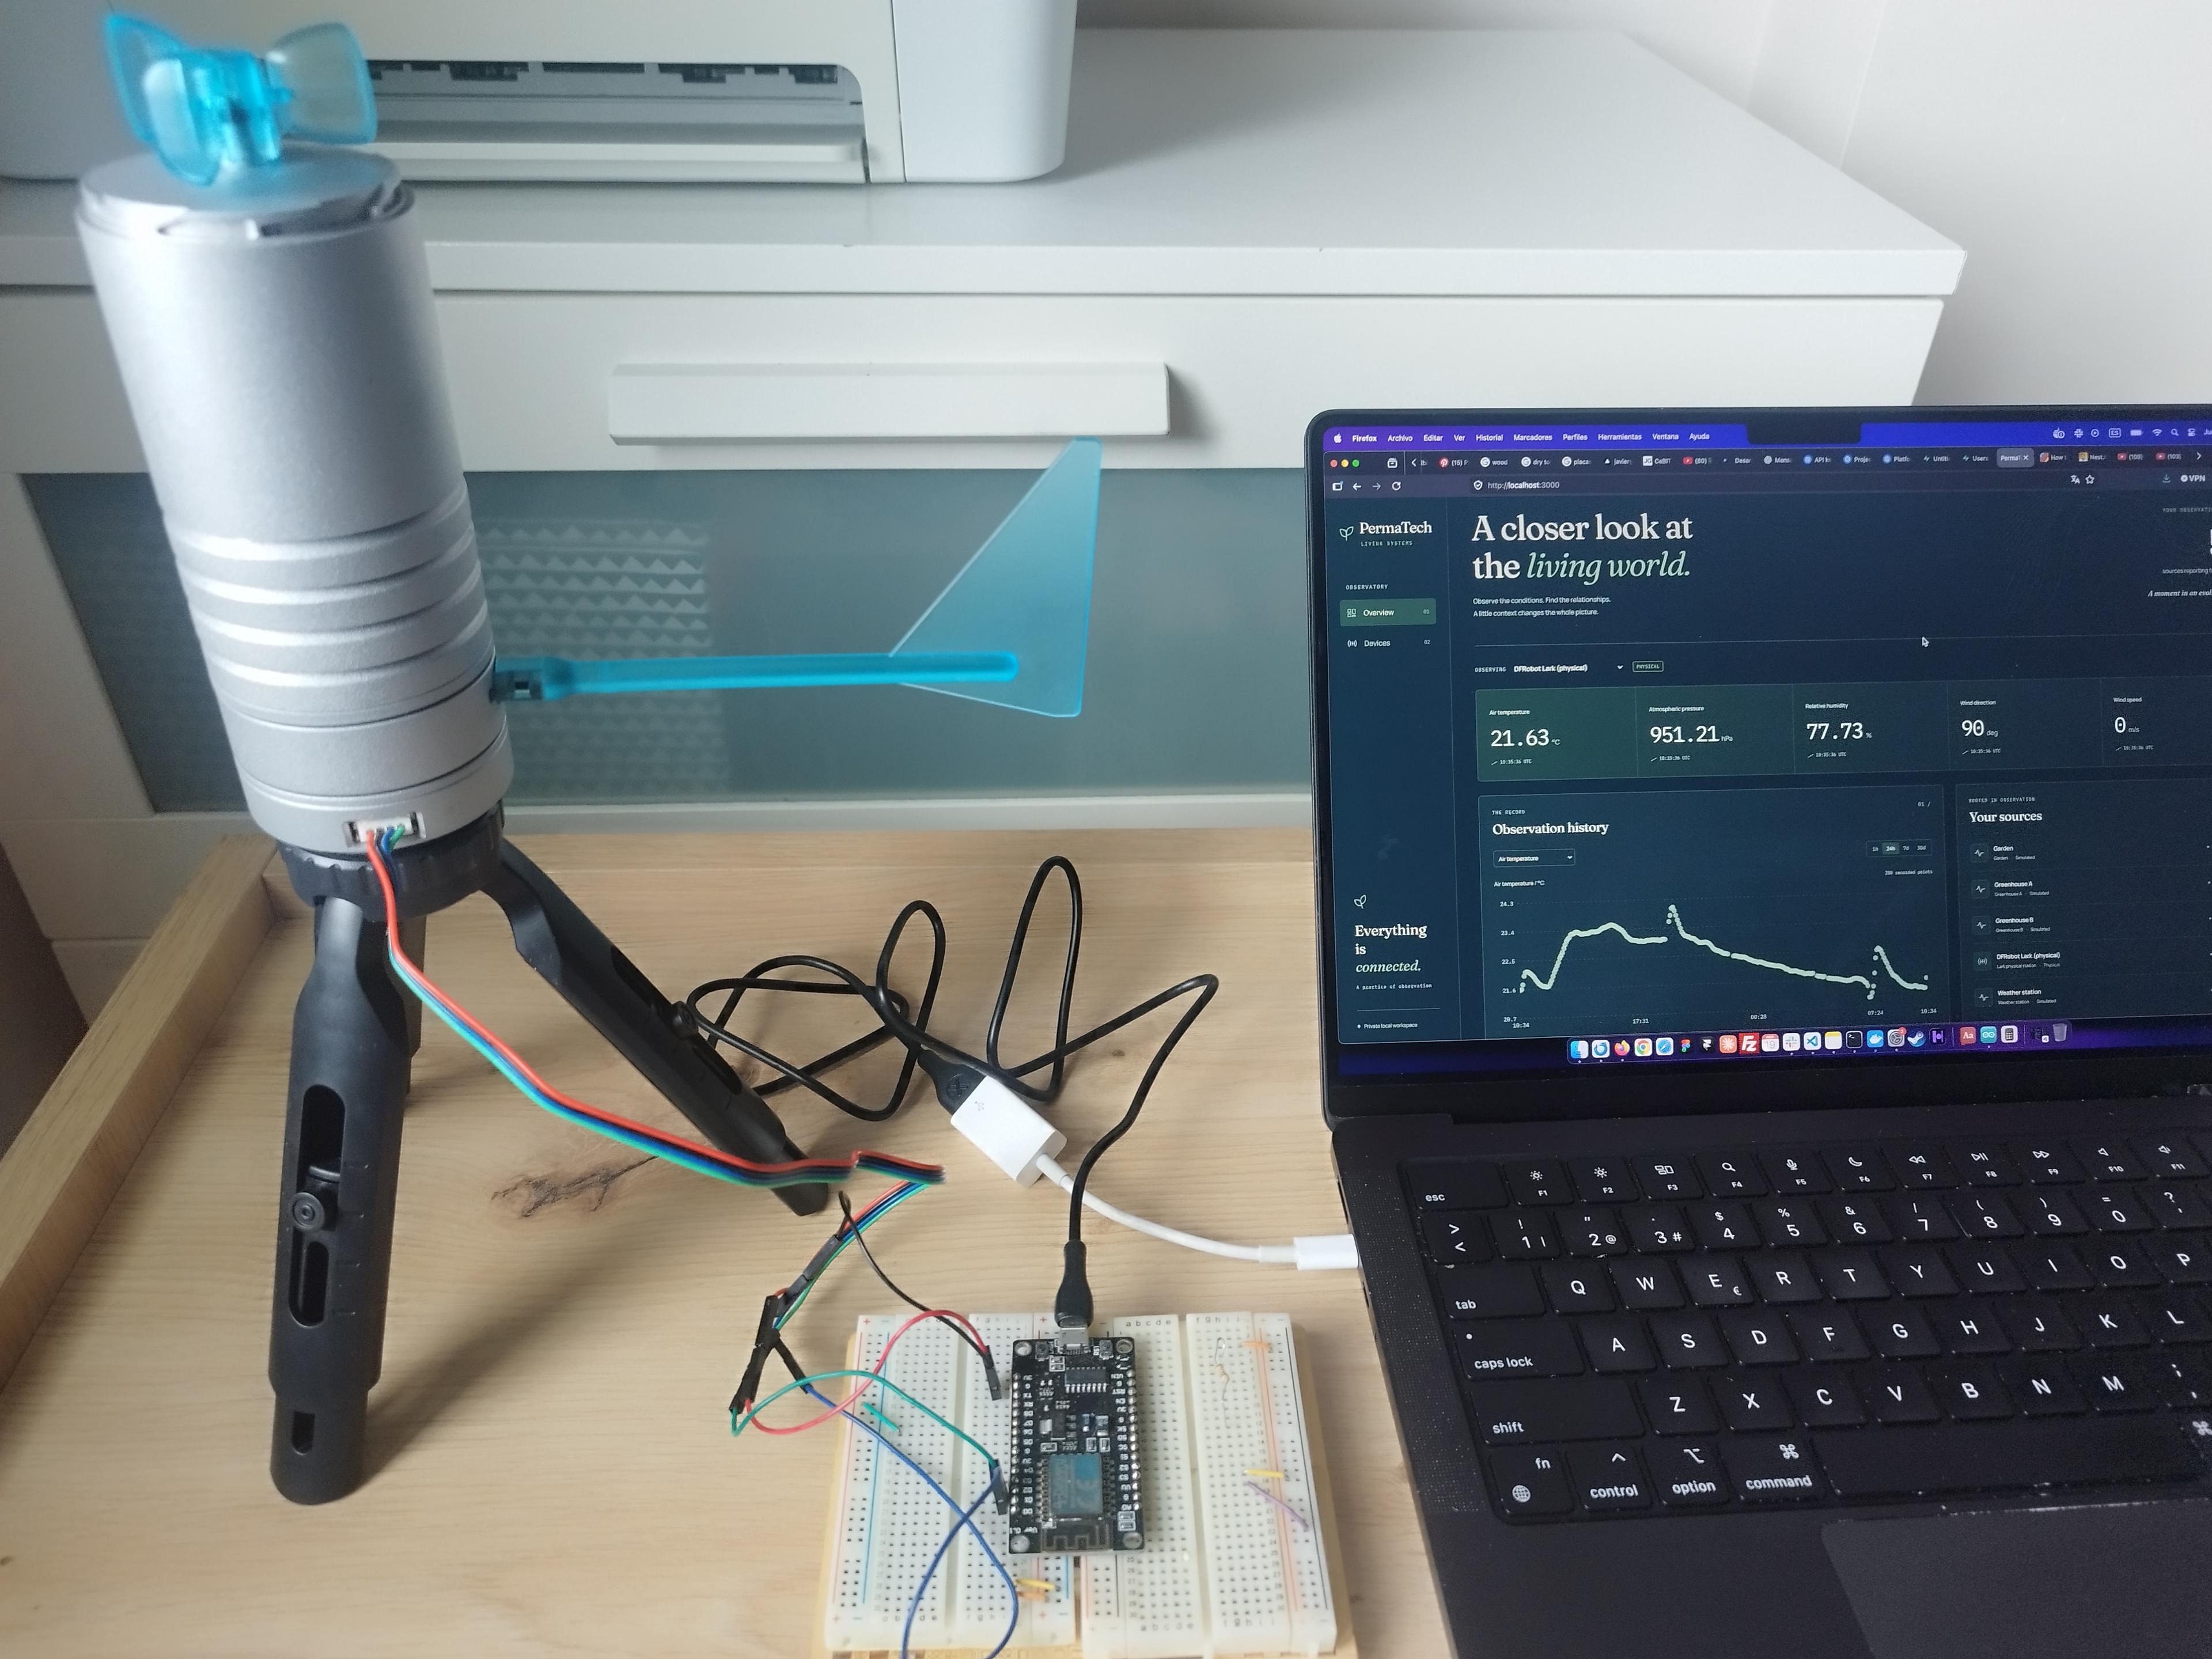
The first physical instrument is a DFRobot Lark weather station connected to an ESP8266 microcontroller. Custom C++ firmware reads the station over I²C, normalizes the readings, synchronizes capture time using NTP and publishes structured telemetry over Wi-Fi. A unique capture identifier follows each observation through the system.
The station measures air temperature, relative humidity, atmospheric pressure, wind speed and wind direction.
03 / System architecture
From physical environments to digital systems
Physical and simulated devices publish environmental observations over MQTT. A Node.js service validates incoming messages and stores them in PostgreSQL. The versioned REST API serves latest observations and history, and WebSocket notifications follow successful database commits.
Acquisition, persistence and presentation are separate parts of the system. Other applications can consume the same environmental data independently of the Living Systems frontend.
01 / Acquisition
Physical environment
DFRobot Lark → I²C → ESP8266
NTP capture time · UUID
Aedes broker
Physical QoS 0
Four labelled simulators · QoS 1
02 / Persistence
Validate & ingest
Node.js · TypeScript · Zod
Shared telemetry contracts
PostgreSQL
Message + five readings
Unique identity · commit
03 / Read & notify
REST API
Reads from PostgreSQL
Latest · History · Recovery
Only after commit
WebSocket
Node.js ingestion callback
Committed event · Best-effort
04 / Presentation
Living Systems
Next.js · React
Current readings · History
Independent clients can consume the same read-only API and event stream.
Acquisition, persistence and presentation remain separate. REST queries the stored observations. The ingestion service emits a WebSocket notification only after its PostgreSQL transaction commits; the database does not broadcast the event directly.
04 / Data engineering
Engineering the data lifecycle
Shared contracts validate incoming telemetry before an atomic database transaction stores the message and its readings. Unique message identifiers prevent duplicate persistence. Capture time records when the device measured the environment, and receive time records when the system accepted the message.
PostgreSQL serves bounded time-series queries and applies metric-specific aggregation. Missing measurements stay absent and zero remains a valid reading. Scalar metrics support minimum, maximum and average. Wind direction is circular, so each aggregated bucket reports its latest captured bearing.
Physical observation / lark-001
One observation. Four views.
Captured 19 November 2026, 10:26:36 UTC. The same identity and five values follow the observation through the backend.
Observation UUID
64267b73-6e4c-44be-95a0-75ebef87bbe0- Air temperature
- 21.24 °C
- Relative humidity
- 73.14 %
- Pressure
- 951.31 hPa
- Wind speed
- 0 m/s
- Wind direction
- 0 deg
The original non-retained MQTT publication from physical lark-001, delivered at QoS 0.
{
  "schemaVersion": 1,
  "messageId": "64267b73-6e4c-44be-95a0-75ebef87bbe0",
  "deviceId": "lark-001",
  "timestamp": "2026-11-19T10:26:36Z",
  "readings": [
    {
      "metric": "air_temperature",
      "value": 21.24,
      "unit": "°C"
    },
    {
      "metric": "relative_humidity",
      "value": 73.14,
      "unit": "%"
    },
    {
      "metric": "atmospheric_pressure",
      "value": 951.31,
      "unit": "hPa"
    },
    {
      "metric": "wind_speed",
      "value": 0,
      "unit": "m/s"
    },
    {
      "metric": "wind_direction",
      "value": 0,
      "unit": "deg"
    }
  ]
}05 / Frontend engineering
A real-time digital experience
The Next.js and React frontend shares TypeScript and Zod contracts with the data service. A persistent WebSocket connection brings in newly committed observations, while REST supplies authoritative state, historical queries and recovery after a disconnect.
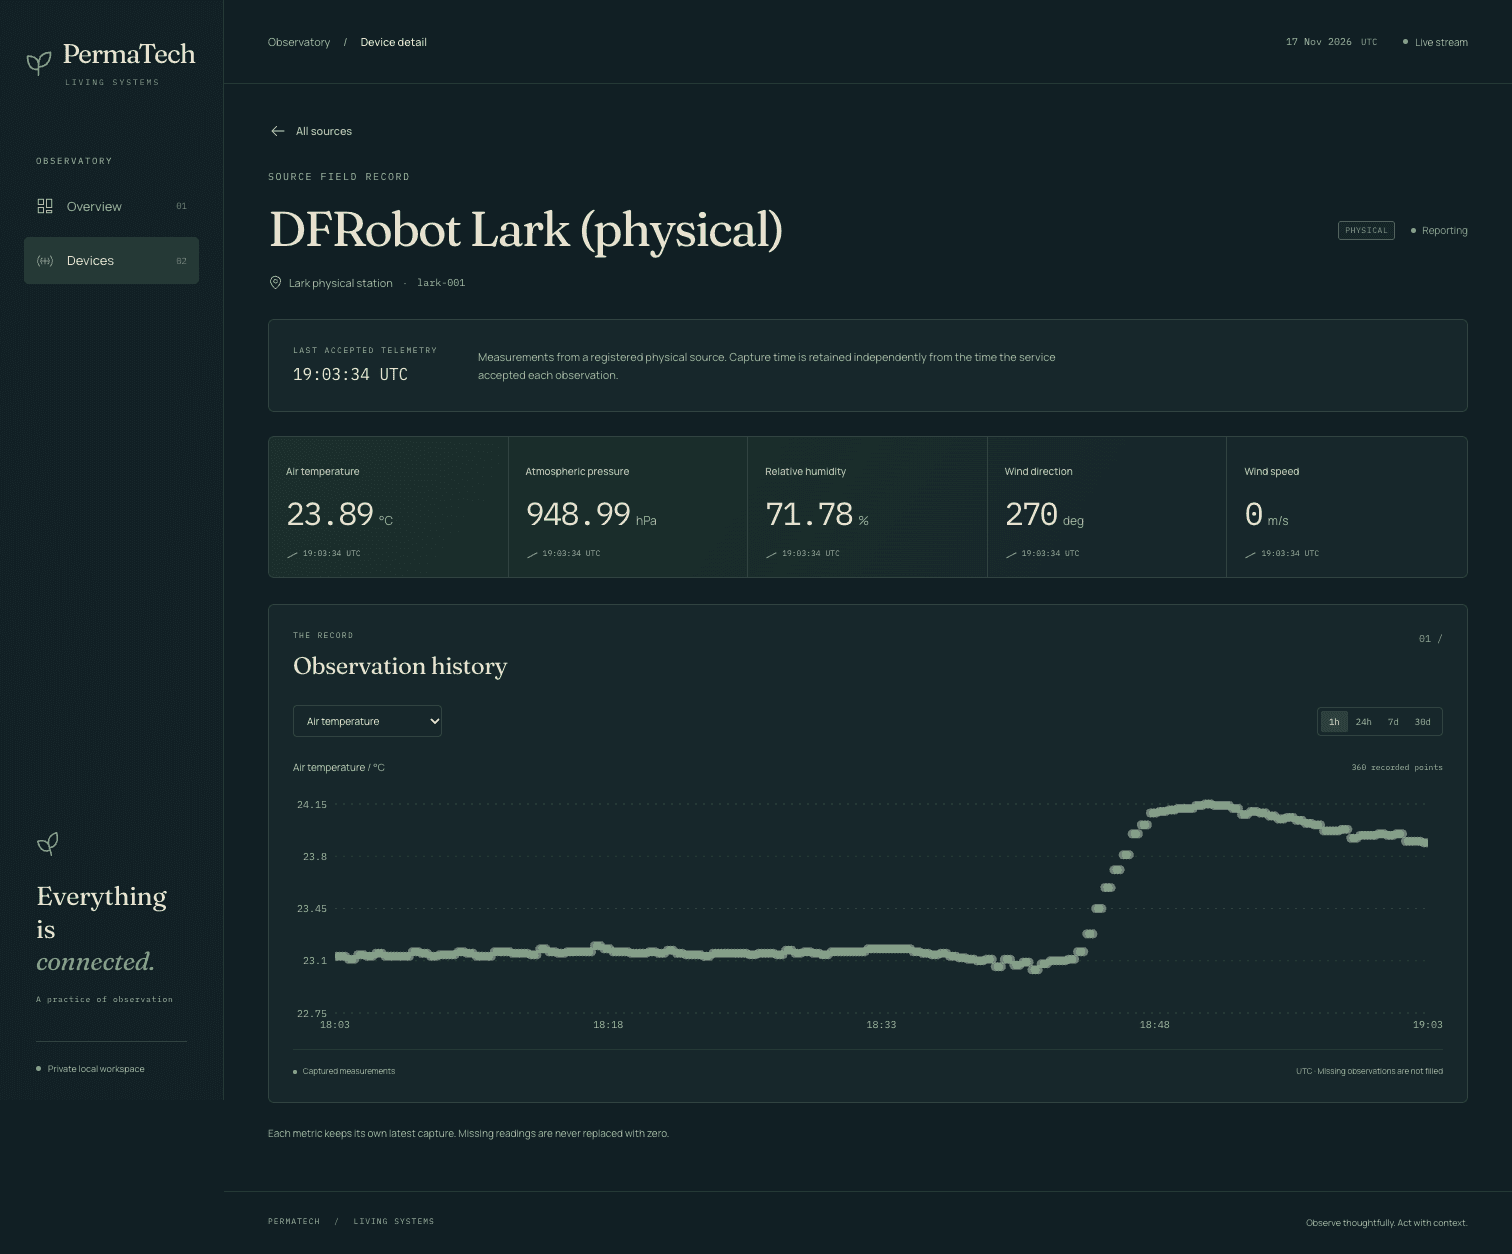
The client deduplicates events and reconciles readings by metric and capture time. Delayed observations cannot overwrite newer readings, and partial observations preserve the last known values of absent metrics. The current application supports physical and simulated devices, live measurements, historical exploration and telemetry freshness indicators.
06 / Visual language
Living Systems
The interface draws on solarpunk, scientific instruments, botanical illustration and organic generative forms. Deep petroleum blues, organic greens and sunlight tones frame the data, with parchment tones and editorial typography for reading.
The visual language is evolving toward a family of interactive instruments that help people notice patterns and relationships in environmental data.

07 / Verification
Engineering reliability
116 automated tests cover data contracts, telemetry ingestion, transactional persistence, API queries and frontend behavior. A physical observation can be traced across MQTT, PostgreSQL, WebSocket and REST through its unique identifier.
I led the architecture, product design, physical integration and verification, using AI to support implementation and testing. The client reconciles incoming observations and recovers its authoritative state through REST after a disconnect.
- 116
- Automated tests passed
- 5
- Environmental metrics
- 10 s
- Configured sampling cycle
- UUID
- Identity across layers
Application baseline / 116 tests
41 contracts + 48 backend integration + 21 frontend data + 6 Chrome browser checks.
Physical evidence session / 110 tests
41 contracts + 48 backend integration + 21 frontend data, rerun on 19 November 2026.
08 / Scope and next steps
An evolving platform
PermaTech is ongoing independent research and development. Future work includes the Environmental Clock, final Device Detail visual refinement, radial visualizations, low-power and LoRa sensor networks, solar-powered instruments and applications in environmental and astronomical monitoring.